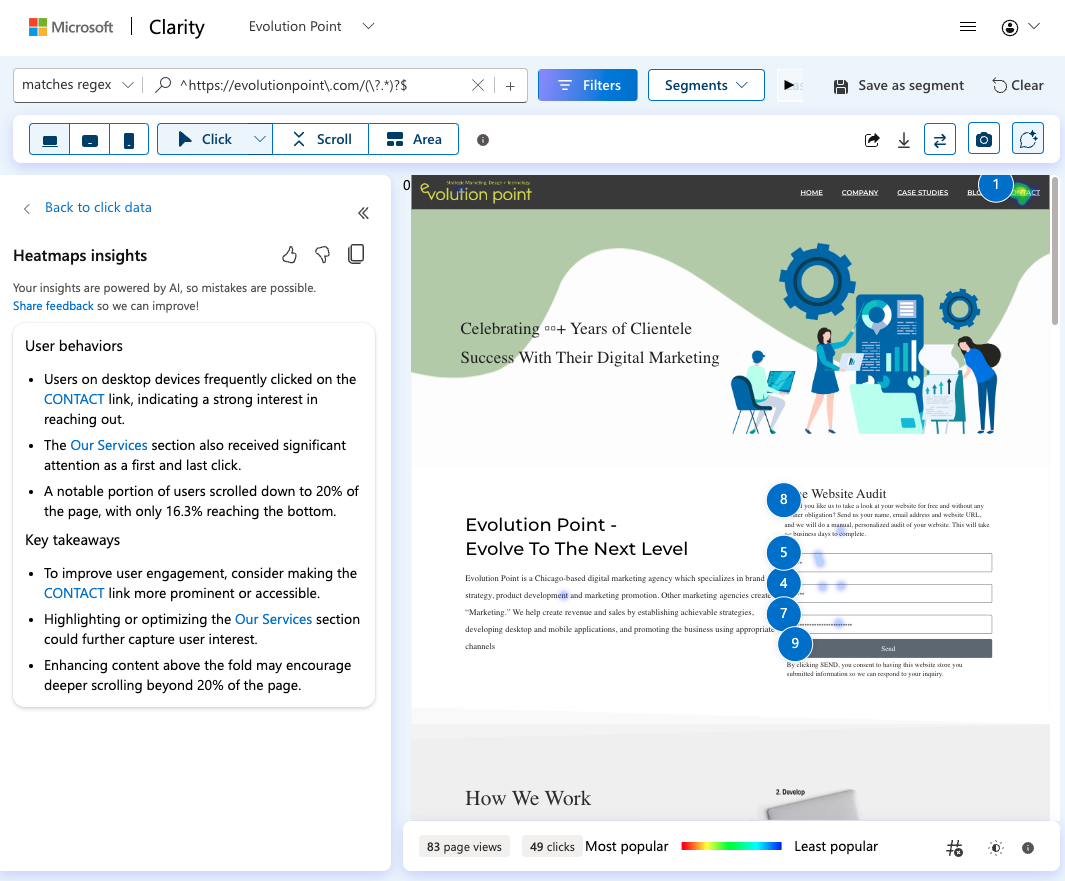
Would you like to have a free web analytics tool to assist you, the digital marketer and website owner, in understanding how users interact with your website? Introducing Microsoft Clarity. With tools like heatmaps and session recordings, Clarity prioritizes qualitative insights over quantitative data. Users can visualize user interactions and pinpoint areas that need improvement with this dual approach. The platform is especially helpful for people who wish to improve user experience and boost conversion rates.
Main Points:
- Microsoft Clarity is a free analytics tool that provides insights into user behavior on their websites.
- Features include session replays, heatmaps, and clickmaps to visualize user interactions.
- Benefits of use include understanding user engagement, identifying usability issues, and improving website performance.
- Tips for getting the most out of Microsoft Clarity include regularly reviewing user sessions, analyzing heatmaps, and using insights to optimize website design and content.

Clarity lets website owners see exactly how users navigate their sites, where they click, and how far they scroll by recording user interactions in real-time. This degree of specificity can highlight issues with the user journey, like unclear navigation or weak calls to action. Microsoft Clarity is therefore a potent instrument for data-driven decision-making, assisting companies in honing their plans based on real user behavior rather than conjecture. Microsoft Clarity boasts a range of features that set it apart from other analytics tools. Session recording, which lets users view live recordings of specific visitor sessions, is one of its most noteworthy features.
This feature offers a close-up view of how users engage with a website, exposing their actions and mental processes as they move between pages. Website owners can spot usability problems and make wise changes to enhance the user experience by examining these recordings. Heatmaps, which visually depict user interactions on a webpage, are another essential Clarity feature.
Users’ clicks, scrolls, and hovers are shown in heatmaps, giving a clear picture of what draws their attention. Businesses can learn from this visual data which aspects of their website are being ignored and which are engaging. The heatmap analysis may suggest that a call-to-action button’s placement or design needs to be reconsidered if it is routinely ignored. Clarity also provides information on user demographics and device types, enabling companies to customize their designs & content for particular markets.
Starting Microsoft Clarity is a simple procedure that calls for little technical know-how. To begin, users must create a free account on the Clarity website. After registering, they can enter the URL of the website they want to analyze to start a new project.
Users will receive a tracking code upon project setup, which they must incorporate into the HTML of their website. Clarity is able to gather information about user interactions thanks to this code. Almost immediately after the tracking code is put into place, Clarity starts collecting data.
To view different metrics and insights regarding the performance of their website, users can access the dashboard. The dashboard is easy to use and offers a summary of important data, including bounce rates, average session length, and total sessions. Also, users can access particular features, such as heatmaps and session recordings, to learn more about user behavior. Website owners can improve user experience and increase conversions by routinely tracking these insights & making necessary adjustments.
Beyond just gathering data, Microsoft Clarity offers actionable insights that can result in notable enhancements to website performance. Finding usability problems that might reduce user engagement is one of the main advantages. For instance, it might be a sign that a form is too long or complex if session recordings show that users regularly stop filling it out in the middle. By taking quick action to resolve these problems, companies can lower bounce rates and raise user satisfaction levels.
Also useful for improving web design are Microsoft Clarity’s heatmaps, which offer a visual depiction of user interactions. Businesses can decide on layout adjustments or content placement by knowing where users are clicking and scrolling. For example, if a heatmap indicates that users are frequently clicking on an image that isn’t connected to any content, it might be worthwhile to make the image clickable or to include more information close by. Based on actual user behavior, this degree of insight enables ongoing adaptation and improvement. A number of differences that show off Microsoft Clarity’s special features can be seen when contrasting it with other analytics programs like Google Analytics or Hotjar.
Although it is well known for its extensive data tracking features, Google Analytics mainly concentrates on quantitative metrics like traffic sources and conversion rates. It lacks Clarity’s qualitative features, like session recordings and heatmaps, but it still offers insightful information about the overall performance of the website. For those looking to gain a deeper comprehension of user behavior, this makes Clarity especially alluring.
Another rival in the analytics market, Hotjar, provides comparable features like session recordings and heatmaps. However, Hotjar uses a freemium business model, which means that although it offers some free features, a paid subscription is needed for many of its more sophisticated features. However, because Microsoft Clarity is completely free, it’s a desirable choice for startups or small enterprises with tight budgets. Also, for companies that already use tools like Azure or Power BI, Clarity’s integration with other Microsoft products can optimize workflows. Microsoft Clarity users should approach data analysis and implementation strategically in order to get the most out of the program.
Before examining the analytics, it is a good idea to establish clear objectives. By establishing a clear definition of success, such as raising conversion rates or lowering bounce rates, users can concentrate their analysis on pertinent data & insights that support their goals. This focused approach guarantees that data analysis time results in improvements that can be put into practice. Reviewing heatmaps & session recordings on a regular basis in addition to other analytics data is another crucial piece of advice. For example, looking at Clarity’s session recordings for a page that has a high bounce rate according to Google Analytics can help explain why users are abandoning that page. By integrating Clarity’s qualitative insights with quantitative data, businesses can gain a more thorough understanding of user behavior & decide what changes are needed.
Are they having trouble navigating? Is there any content that doesn’t engage? Also, using Clarity’s insights to inform A/B testing can result in notable enhancements to website performance.
For instance, if heatmaps show that users are not interacting with a particular call-to-action button, companies may want to experiment with different button colors or locations to see if they have a positive impact on click-through rates. Organizations can create an environment of continuous optimization that eventually improves user experience and propels business success by iterating frequently based on actual user feedback from Clarity. In conclusion, Microsoft Clarity’s distinctive fusion of session recordings and heatmaps makes it a potent tool for comprehending user behavior. Because it is free to use, it is a desirable option for companies wishing to improve their online visibility without spending extra money. Through efficient use of its features and the incorporation of insights into more comprehensive analytics plans, businesses can gradually enhance the performance and usability of their websites.
If you’re exploring tools like Microsoft Clarity to enhance your website’s user experience and analytics, you might also be interested in integrating these insights into a broader marketing strategy. A comprehensive approach can significantly amplify your results. I recommend reading an insightful article on why and how to integrate your marketing strategy across all channels. This piece provides valuable tips that can help you align your digital efforts, including the data you gather from Microsoft Clarity, to achieve cohesive and effective marketing outcomes. You can read more about it here: Integrating Your Marketing Strategy on All Channels.
FAQs
Microsoft Clarity is a free analytics tool that helps website owners understand how users are interacting with their website. It provides insights into user behavior, heatmaps, and session replays.
Microsoft Clarity collects data on user interactions with a website, including clicks, scrolls, and mouse movements. It also provides heatmaps and session replays to visualize user behavior.
Yes, Microsoft Clarity is a free analytics tool provided by Microsoft.
Microsoft Clarity helps website owners by providing insights into user behavior, allowing them to optimize their website for better user experience and conversion rates.
Microsoft Clarity is compatible with most websites, including those built on popular platforms like WordPress, Shopify, and Squarespace. It requires adding a small piece of code to the website for tracking.

Contact Us
Mailing Address:
500 Westover Drive, #12992
Sanford, NC 27330
Phone: (312) 733-1100
Fax: (312) 624-6780
Email: info@evolutionpoint.com
